How to Quickly Add Error Bars in Excel [Standard, Custom]
You can add an error bar using the Ribbon on MS Excel
- The error bar is a statistical tool that analyzes the data variability on a chart.
- The inability to add it in Excel makes providing data accuracy in both positive and negative extents impossible.
- You can add an error bar to the chart using the ribbon, standard error bar, and custom.
Microsoft Excel is part of the famous Microsoft suite used for statistical calculation, charts, graphs, and data analysis. However, adding an error bar in Excel has challenged most users because they can’t measure variability on a graphical representation.
Moreover, adding an error bar in Excel is complex to understand without proper guidance, so we have compiled this article. Thus, we will explicitly discuss an error bar and how to add it in Excel.
What are error bars In MS Excel?
- The error bar in Excel is the exact measurement of data variability on a graphical representation.
- The precise lines drawn on a graph give you a comprehensive view and illustrate complicated statistical tests easily.
- Errors are the uncertainty level between two statistical measurement groups.
- Adding the error margins provide information about data accuracy in both positive and negative extents.
There are different types of error bars that you can use in Excel:
- Standard error indicates the deviation between the mean and the total population.
- Percentage Error shows the negative and positive sides.
- Standard Deviation shows the proximity of the mean or average to the total population.
Having given insight into this, we will show you step-by-step details of inserting it in Microsoft Excel.
How do I insert error bars in Excel?
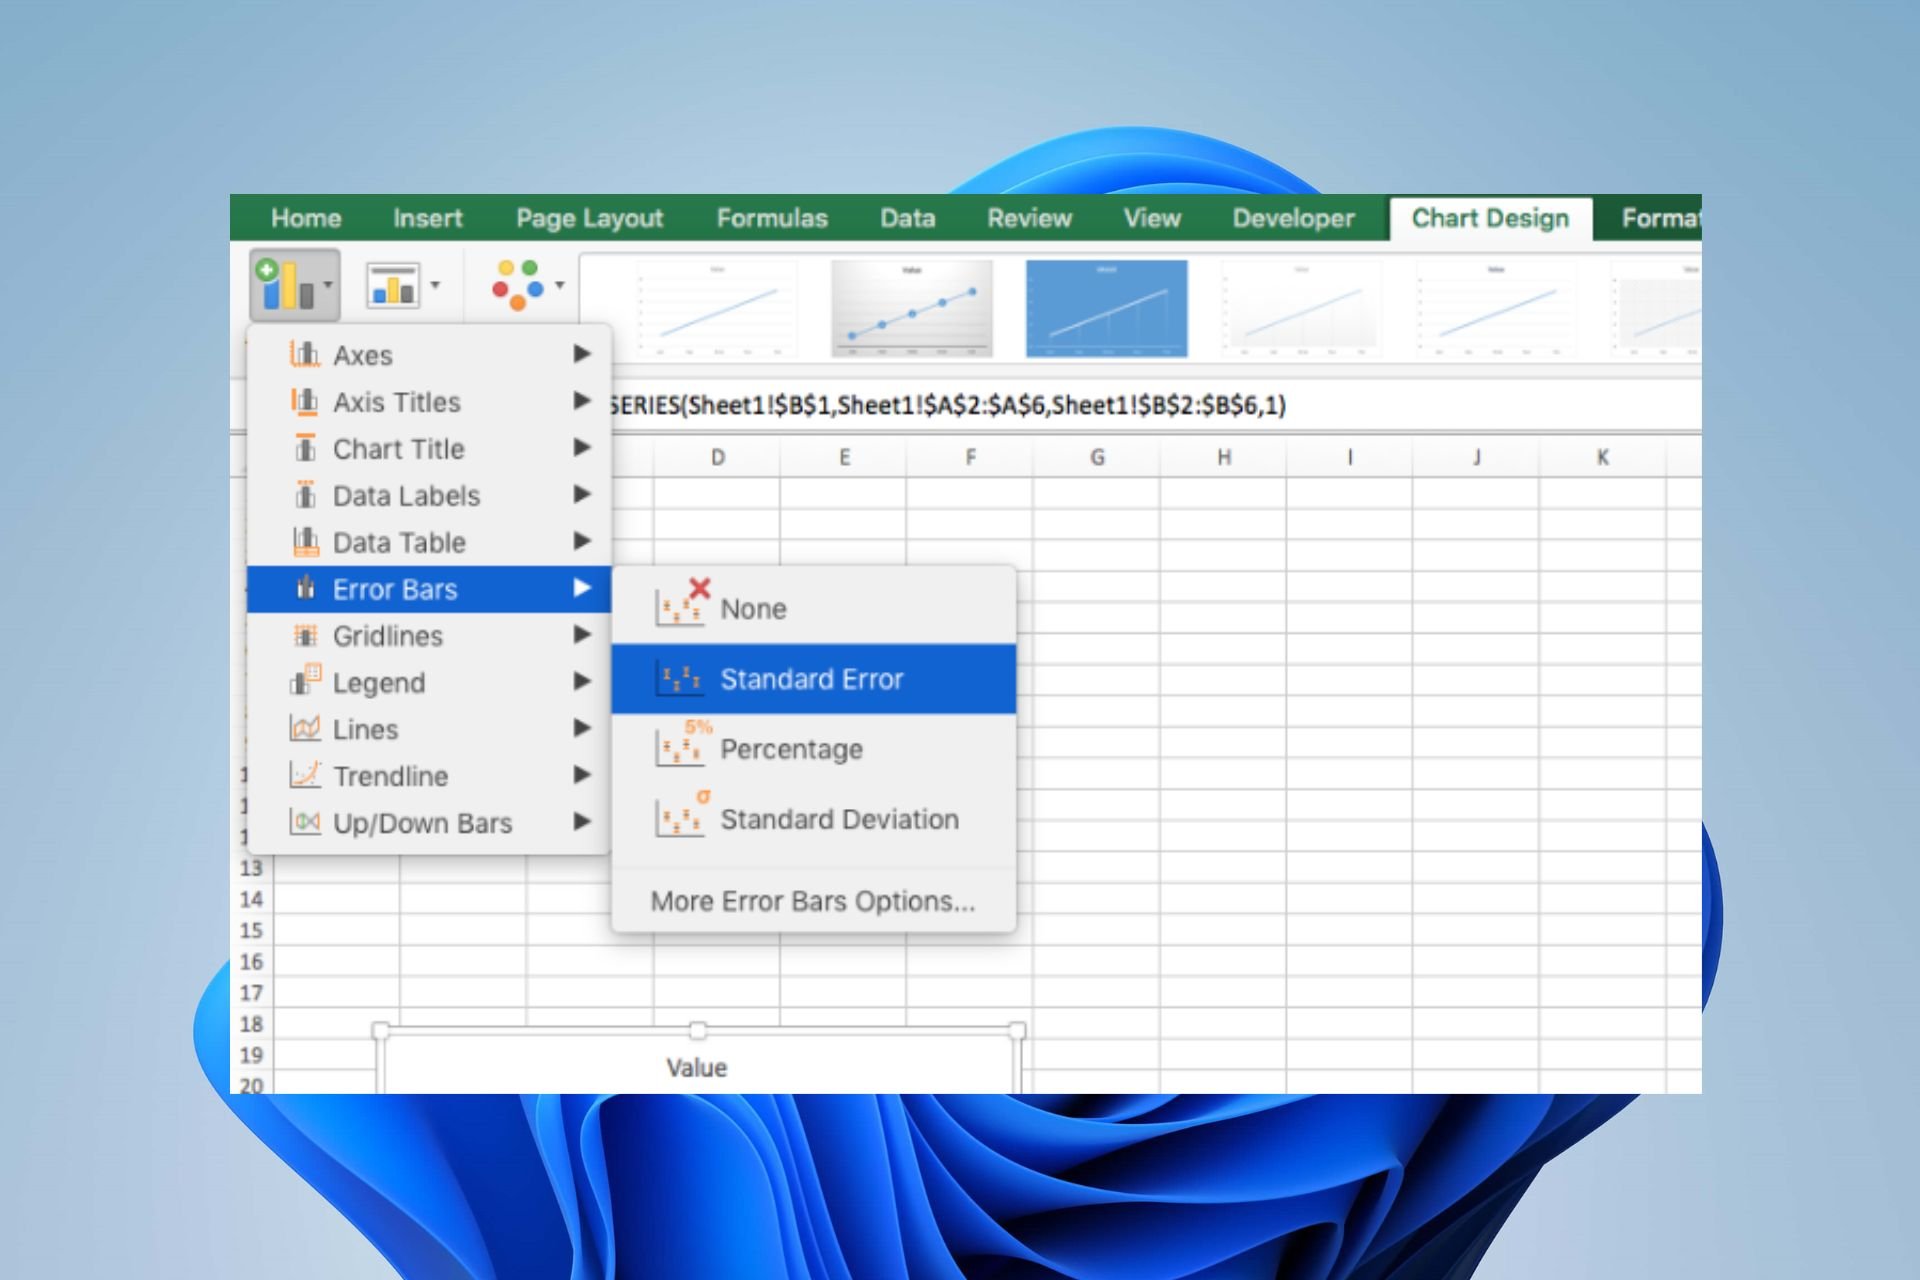
1. Add an error bar using the Ribbon
- Open the MS Excel app, create a graph on the spreadsheet, and click on it.
- Click the + Add Chart Element drop-down arrow at the bottom left corner of the Ribbon and select Error Bars from the menu.

- Select the desired error bar from the sub-context menu to add the error line to your graph.
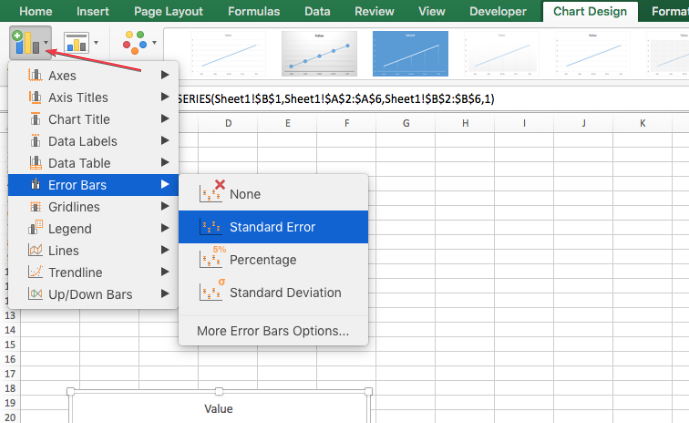
The Ribbon provides a simple means to insert error bars in Excel.
2. Add a standard error bar
- Select anywhere on the chart
- Click the + Chart Element button on the right-hand side of the graph.
- Click the arrow next to the Error Bars and select the Standard error.

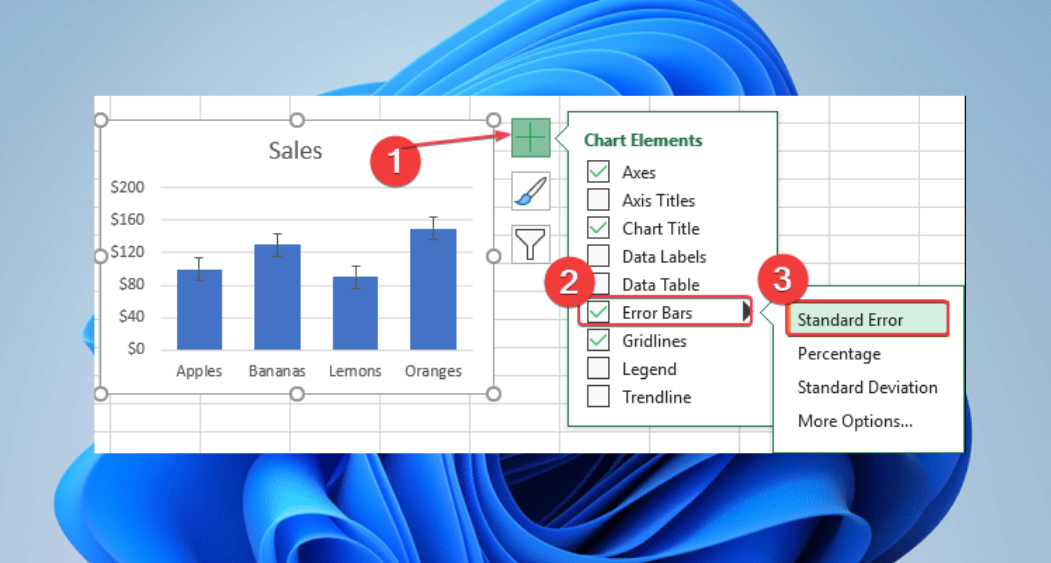
Adding standard error bars in Excel gives straightforward and well-represented variability data.
3. Add a custom error bar
- Click on the graph and click the + Chart Element button on the right-hand side of the graph.
- Then, click the Error Bar Arrow and select More Options from the sub-context menu.
- Click the chart icon to go to the Error Bar Options on the Format Error Bar context menu.
- Navigate to the Error Amount category, click the Custom radio button, and select the Specify Value button to open a Custom Error Bar dialog box.

- Click on the Positive Error Value and input your value.
- Select the Negative Error Value field and enter your figures accordingly.

- Select the OK button to display the Error Bar on your chart.
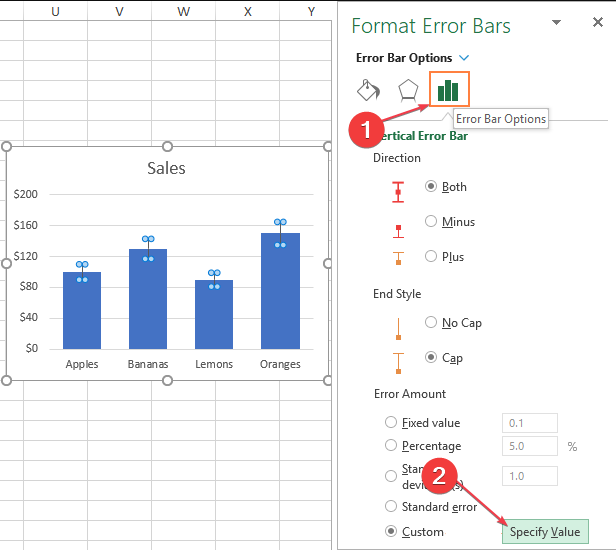
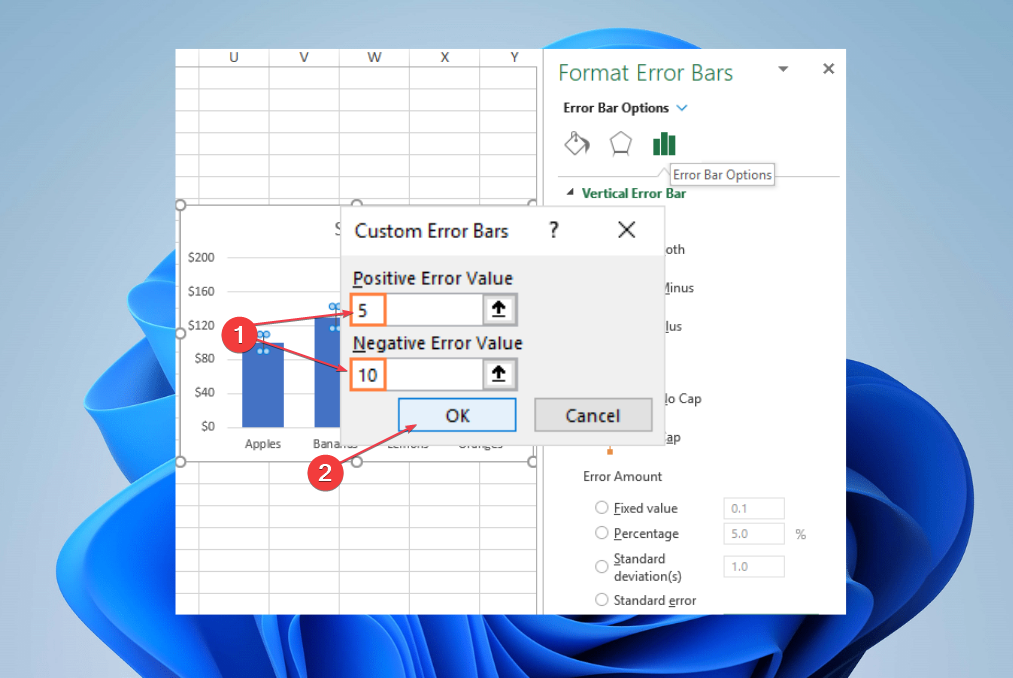
Adding a custom error bar in Excel allows you to select specific data variability and have tailored error representation.
In conclusion, you can read our detailed guide about how to fix Excel is not opening with easy steps. Also, we have a complete guide about quick ways to fix Excel running slow on Windows devices.
Should you have further questions or suggestions, please drop them in the comments section below.
Still experiencing issues?
SPONSORED
If the above suggestions have not solved your problem, your computer may experience more severe Windows troubles. We suggest choosing an all-in-one solution like Fortect to fix problems efficiently. After installation, just click the View&Fix button and then press Start Repair.